
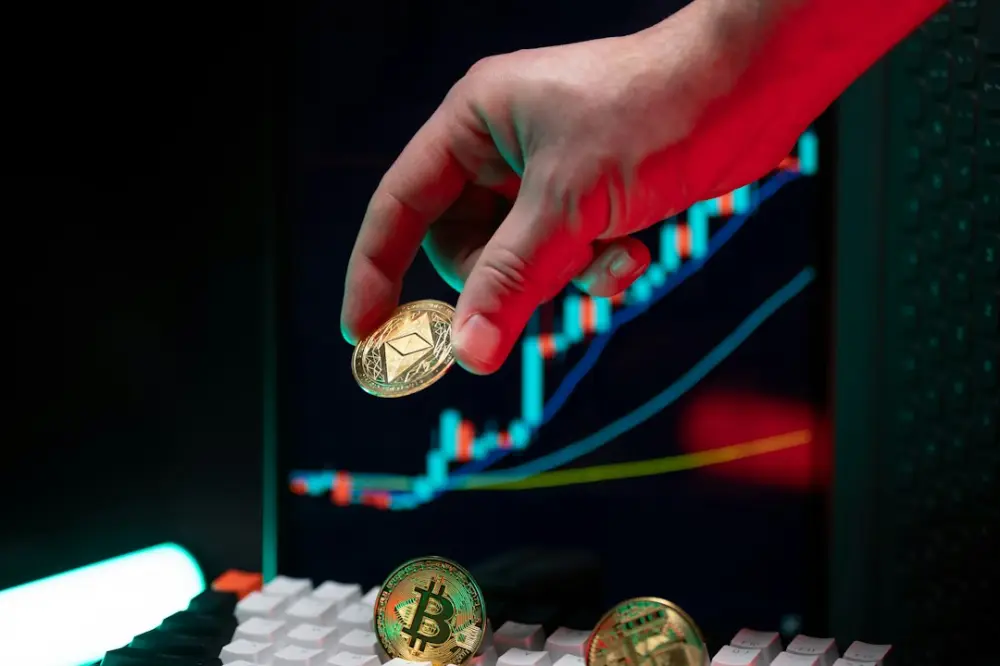
Technical analysis (TA) for crypto is a trading discipline used to evaluate investments and identify opportunities by analyzing statistical trends gathered from trading activity, such as price movement and volume. Unlike fundamental analysis, which focuses on a coin's intrinsic value, TA uses historical chart patterns and mathematical indicators to predict future price behavior.
For active participants, this methodology provides a framework to navigate the inherent volatility of digital assets. By identifying recurring structures like support and resistance levels, traders can make more objective decisions. This approach moves away from emotional reactions and toward a systematic methodology based on how the market has historically reacted at specific price points.
What is Crypto Technical Analysis?
The premise of technical analysis is that market prices are not purely random. Instead, they follow trends that are influenced by the collective psychology of all market participants. In the crypto market, where sentiment can shift rapidly, TA acts as a map to help identify where the price has been and where it might be going. It relies heavily on candlestick charts, which provide more data than simple line graphs by showing the opening, closing, high, and low prices for a specific time period.
One of the primary tenets of this discipline is that the market discounts everything. This means that all known information—regulatory news, technological updates, and macroeconomic shifts—is already reflected in the current price of a token like Bitcoin or Ethereum. Therefore, a technical analyst focuses on the chart itself rather than the news cycle. If a specific pattern, such as a "Double Bottom," appears on a chart, the analyst assumes that the buying pressure that created that pattern in the past will likely behave similarly again.
For example, a trader looking at a 4-hour chart of a mid-cap altcoin might notice a "Golden Cross," where the 50-day moving average crosses above the 200-day moving average. Historically, in various market cycles, this has often signaled a long-term shift from a bearish to a bullish trend. By recognizing this specific mathematical crossover, the trader can move from a speculative guess to a data-backed hypothesis about the asset's next major move.
Technical vs. Fundamental Analysis
While technical analysis looks at the "how" and "when" of price movement, fundamental analysis (FA) focuses on the "why." FA involves looking at the team behind a project, the utility of the token, its tokenomics, and the overall health of the blockchain network. A fundamental analyst might look at the increasing number of active wallets on a Layer 2 network as a reason to buy, believing the asset is undervalued relative to its utility.
In contrast, a technical analyst might see the same asset hitting a multi-year resistance level and decide to sell, regardless of how good the project's technology is. The two methods are often most effective when used together. If FA tells you that a project has a strong long-term future, TA can help you find an optimal entry point so you aren't buying at a local peak. This synergy is vital because even the most fundamentally sound projects can experience 50% retracements during a broader market correction.
Consider a scenario where a major decentralized finance (DeFi) protocol announces a significant partnership. A fundamental analyst sees this as a long-term growth driver. However, a technical analyst notices that the price is currently overextended and touching the upper boundary of a long-term ascending channel. The technical analyst might wait for a price pullback to a known support level before entering, even though the news is positive. This patience prevents the common mistake of "FOMO" (fear of missing out) buying during a temporary price spike.
Essential Indicators for Reading Charts
Indicators are mathematical calculations based on price and volume that help filter out market noise. The Relative Strength Index (RSI) is one of the most common tools used to identify whether an asset is overbought or oversold. It operates on a scale of 0 to 100. Generally, an RSI above 70 suggests that the price has risen too fast and may be due for a correction, while an RSI below 30 suggests the asset is undervalued in the short term.
Another powerful tool is Bollinger Bands. These consist of a middle moving average and two outer bands representing standard deviations. When the bands contract, it indicates low volatility, often referred to as a "squeeze." This period of calm is almost always followed by a significant price expansion in either direction. Traders use this to prepare for a breakout, watching for a candle to close outside the bands as a signal of the new trend's direction.
For example, if a trader is monitoring Solana (SOL) and notices that the Bollinger Bands are the tightest they have been in months, they know a big move is coming. If the price then breaks upward with high volume while the RSI is still below 60, it suggests there is plenty of room for the price to run before becoming overextended. This combination of indicators provides a much clearer picture than looking at price alone. Other essential tools include Moving Average Convergence Divergence (MACD) for momentum and Volume Profile to see at which price levels the most trading activity has occurred.
Practical Application and Risk Management
The most important part of technical analysis isn't predicting the future perfectly; it is managing risk when you are wrong. No indicator is 100% accurate, and the crypto market is famous for "fakeouts," where the price breaks a resistance level only to immediately reverse. To combat this, technical analysts use stop-loss orders. A stop-loss is a pre-set price at which your position will automatically close to prevent further losses.
Risk management also involves position sizing. A disciplined trader might decide never to risk more than 1% or 2% of their total account balance on a single trade. By calculating the distance between the entry price and the stop-loss level, they can determine exactly how many tokens to buy. This ensures that even a string of losing trades will not deplete their capital, allowing them to stay in the market long enough to catch a major trend.
For instance, if a trader enters a position on Cardano (ADA) at $0.50 because it hit a support level, they might place a stop-loss at $0.48. If the market suddenly drops, their loss is capped at $0.02 per token. Without this technical plan, a trader might hold the asset all the way down to $0.30, hoping for a recovery that might not come for months. This objective approach is why many successful participants view TA as a tool for capital preservation first and profit generation second.
Using Market Data to Inform Your Strategy
Success in digital asset trading requires a broad view of the environment. While individual charts are useful, they exist within the context of the total market capitalization and Bitcoin's dominance. Understanding how market cycles still define the way digital assets behave allows you to adjust your technical expectations. In a macro bull market, technical breakouts are more likely to succeed; in a bear market, they are more likely to fail.
As we move through late 2026, the integration of institutional data and on-chain metrics has made technical analysis more nuanced. It is no longer just about drawing lines on a screen; it is about interpreting the flow of capital. High-volume nodes on a chart often align with the "cost basis" of large institutional holders, creating strong levels of support that were not present in previous years. Keeping an eye on the top crypto trends to watch in the recent past helps contextualize which sectors—like AI tokens or modular blockchains—are currently attracting the most liquidity.
At XcelToken, we believe that data literacy is the ultimate equalizer in the crypto market. Technical analysis is not a crystal ball, but a language that helps you read the collective intentions of millions of other participants. By mastering the basics of chart patterns, indicators, and risk management, you move away from the noise of social media hype and toward a more sustainable, data-driven approach. Our goal is to provide the insights necessary to help you understand these cycles and trends, ensuring you have the tools to navigate the market with clarity and confidence.